Fleet managers face numerous challenges, from unexpected downtime and maintenance issues to escalating fuel costs.
Fortunately, making informed decisions to optimize your fleet is far easier when you can rely on data-driven insights.
Tracking the right fleet management metrics helps construction businesses uncover inefficiencies and map opportunities for improvement.
However, knowing where to focus can be tricky.
To help you get started, we’ve outlined 13 essential fleet management metrics across four categories that will help you streamline operations, boost efficiency, and reduce costs.
Let’s dive in!
In this article...
Fleet Utilization Metrics
These metrics tell you all about how you’re utilizing your fleet.
By tracking your fleet’s utilization, you can identify weaknesses more easily and turn them into opportunities to maximize productivity.
Vehicle Utilization Rate
Calculating vehicle utilization rate is the key element of construction fleet tracking that tells you whether you’re using your vehicles effectively.
Getting the numbers is easy: divide the vehicle’s actual use time by the total available time and multiply the result by 100.
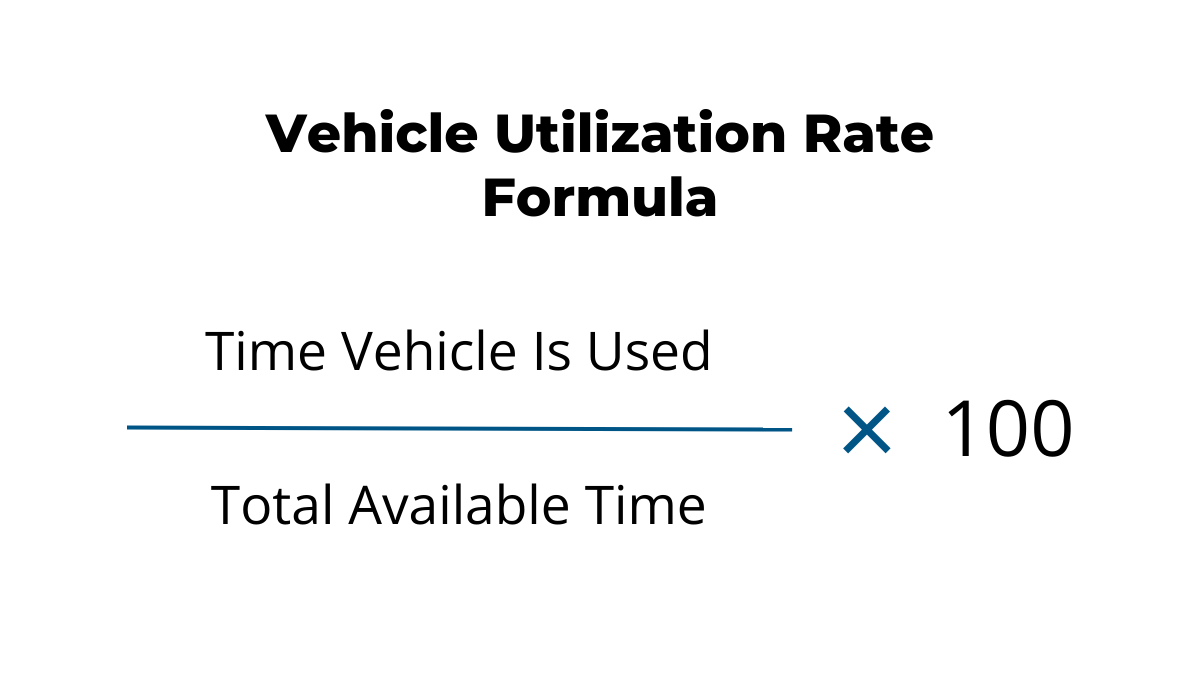
A high utilization rate usually means efficient scheduling and resource allocation, but not always.
If one vehicle is highly utilized, there’s a chance that the other assets are underutilized, so be careful when drawing conclusions.
Tracking this metric helps fleet managers assign day-to-day tasks, identify underused assets, and decide whether to redistribute or reduce the fleet size.
With regular monitoring, you can also map different seasonal or operational trends that impact usage.
In this way, you’re creating a foundation for improving overall productivity.
Vehicle Downtime
Keeping track of vehicle downtime means logging the total time a vehicle is out of service due to maintenance, repairs, or other operational issues.
This figure is then compared against the vehicle’s potential working hours to assess its availability.
High downtime can signal many things, from inefficient maintenance scheduling and recurring mechanical issues to unexpected supply chain delays.
Minimizing downtime directly impacts fleet efficiency and reduces the costs associated with idle assets, but it requires regular analysis.
That way, you can uncover root causes and come up with the best plan of action.
In line with this, fleet managers increasingly rely on telematics systems to improve data collection, track trends, and increase uptime.
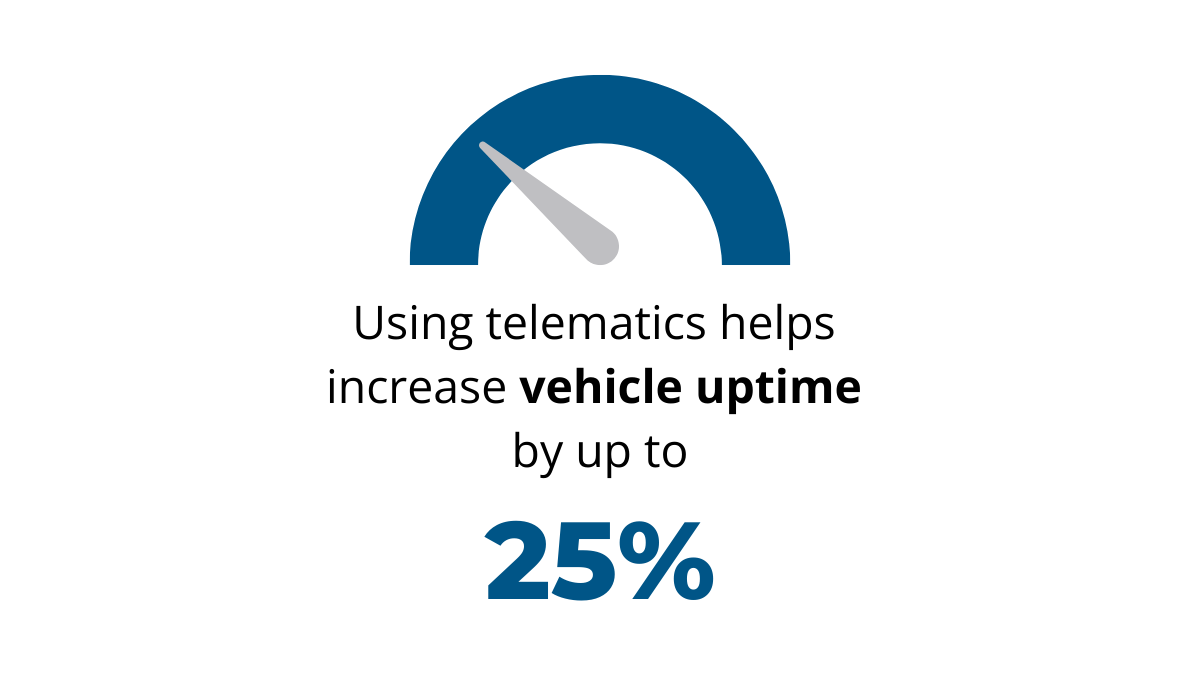
While minimizing downtime helps you improve vehicles’ operational reliability and increase productivity, remember that planned downtime is also essential for long-term fleet performance.
Vehicle Idle Time
This metric measures the duration that the vehicles spend idling.
Leaving the engine running wastes fuel, accelerates wear and tear, and leads to higher emissions, but it often goes undetected.
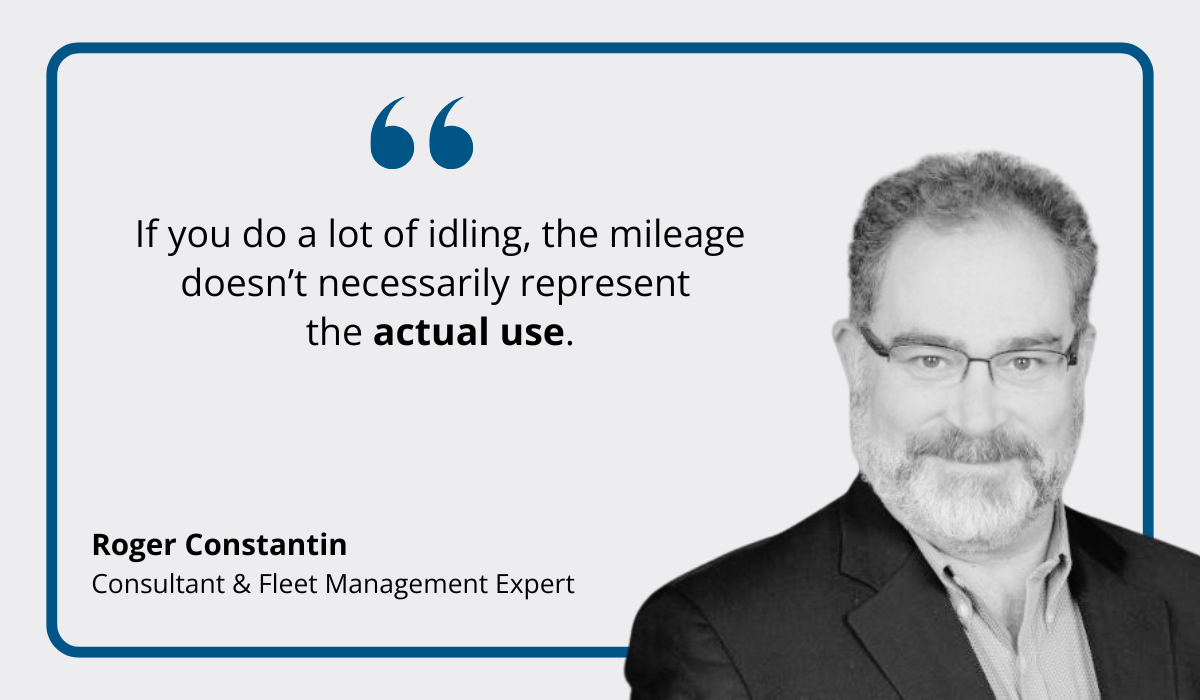
Fleet management expert and consultant Roger Constantin notes that many companies track only mileage which doesn’t reflect the vehicle’s actual usage.
On the other hand, monitoring idling brings greater awareness of the asset’s overall conditions, along with scheduling inefficiencies or negative driver behaviors.
Companies that track this metric know whether to implement mandatory driver training, improve scheduling, or adopt fuel-saving policies.
Fuel Consumption Rate
With this metric, you’re looking into the amount of fuel consumed per mile or kilometer.
The goal is to measure the efficiency of fuel use, with a high fuel consumption rate pointing to poor route optimization or vehicle maintenance, as well as suboptimal driving behaviors.
Latest surveys show that rising fuel costs are one of the top concerns among fleet managers, which gives rise to new fleet management trends and makes this metric even more relevant.
Monitoring fuel consumption rate enables managers to identify trends and adopt the most effective corrective actions, such as fuel-saving initiatives.
Of course, pinpointing wasteful practices is easier with access to comprehensive telematics data and advanced reporting features.
Here’s what that looks like with our GoCodes Asset Tracking asset management solution.
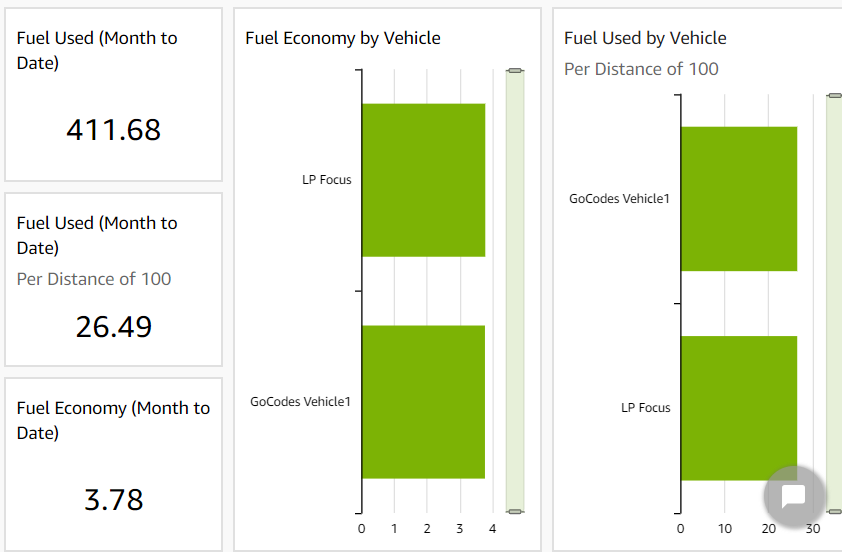
Any improvements in this area translate to reduced costs and environmental impact, making it a key focus for sustainable fleet management.
Fleet Maintenance Metrics
This set of metrics focuses on vehicle health and upkeep, ensuring reliability, safety, and ongoing cost control.
Preventive Maintenance Compliance Rate
Also known as PM on-time completion rate, this metric tracks the percentage of scheduled maintenance tasks completed on time.
In other words, it helps businesses get a sense of how effectively their maintenance programs prevent breakdowns.
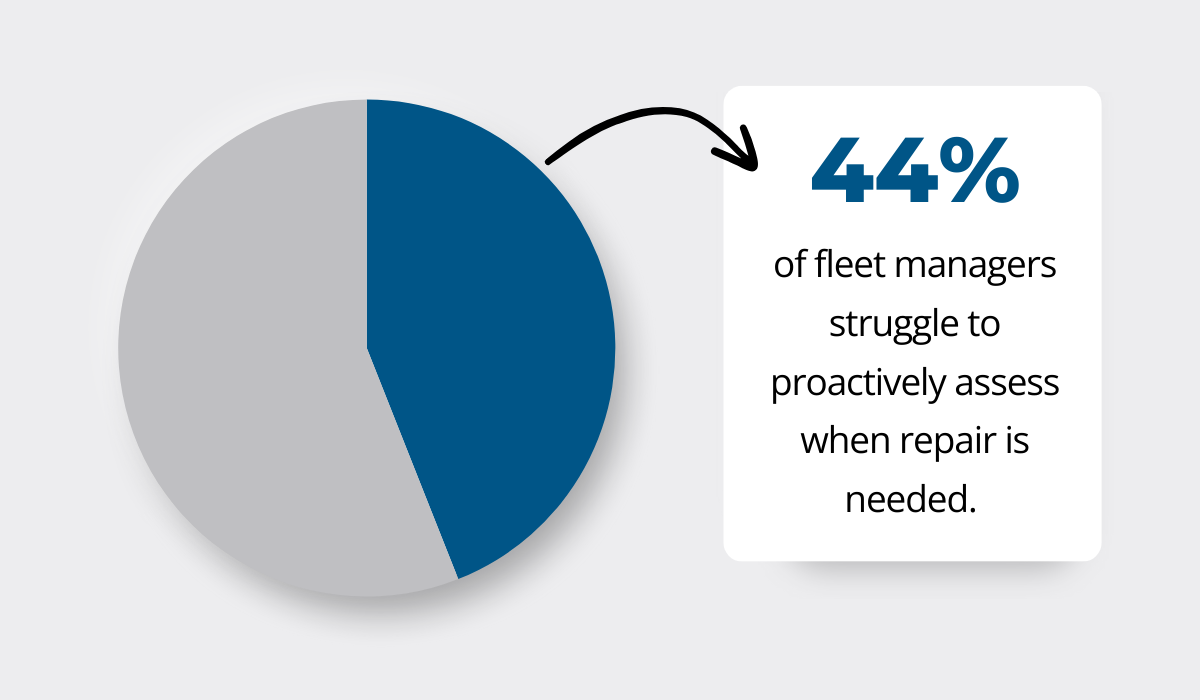
Research suggests that nearly half of fleet managers struggle to assess when a repair is needed, which shows just how important it is to stick to your preventive maintenance schedule.
By consistently meeting preventive schedules, you’re ensuring that your fleet remains in optimal condition.
Once again, telematics solutions are proving critical for ensuring consistent and effective fleet maintenance.
Automated alerts and tracking tools simplify scheduling and bring more accountability, which can help you improve compliance.
Overall, focusing on this metric will minimize disruptions and maximize fleet performance.
Time to Repair
As the name implies, time to repair measures the average time it takes to fix an asset and have it return to operation.
Quick repair times mean less downtime, so your technicians’ productivity is crucial for getting the vehicles back on the road and keeping the costs in check.
Conversely, long repair time suggests inefficiencies that will need to be solved by overhauling your workflows, bringing in extra hands, or adopting other corrective measures.
By tracking repair times, fleet managers are in a better position to identify bottlenecks and counter disruptions to keep the fleet functional.
Your goal here is to reduce repair time, and doing so guarantees operational continuity while minimizing costs associated with vehicle inactivity.
Mean Time Between Failures (MTBF)
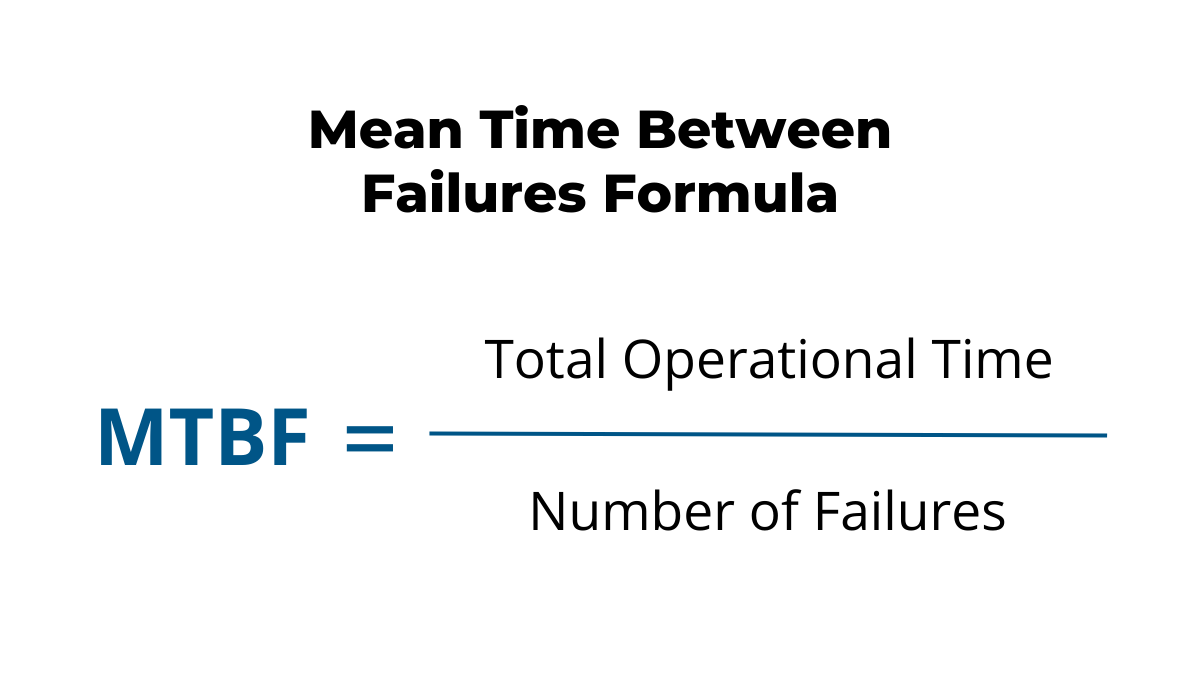
MTBF helps you calculate the average operational time between vehicle breakdowns or failures, indicating the overall reliability of your fleet.
As you can see below, the formula is simple:
A high MTBF means that the vehicles are well-maintained and dependable, as opposed to experiencing frequent failures.
Tracking this metric enables fleet managers to predict and plan for maintenance needs, and make smarter decisions.
For example, these insights can help them uncover systemic issues which are affecting performance, or point them in the direction of investing in more reliable assets overall.
In the end, the impact of tracking and improving MTBF will be evident in more balanced maintenance schedules and vehicle usage, as well as fewer disruptions.
With the vehicles staying operational for longer periods, you’ll be looking at a productivity boost and lower repair costs.
Maintenance Cost per Mile
This is another self-explanatory metric that helps you calculate the average maintenance expense for each traveled mile.
The numbers you get by tracking maintenance cost per mile will reflect the cost efficiency of fleet operations.
Namely, increased maintenance costs per mile can signal a range of things, including:
- Aging vehicles
- Inadequate preventive maintenance
Tracking this metric allows fleet managers to adjust their maintenance strategies and confidently make decisions to replace vehicles which are underperforming or need frequent repairs.
The main benefit here?
Ensuring timely servicing and improving maintenance enables companies to extend the lifespan of their assets while controlling related costs.
Fleet Safety Metrics
Safety metrics focus on reducing risks by promoting safe driving habits and ensuring compliance with all relevant regulations.
Driver Behavior Score
Keeping track of this metric enables businesses to evaluate and address problematic driving behaviors and habits, such as speeding, harsh braking or acceleration.
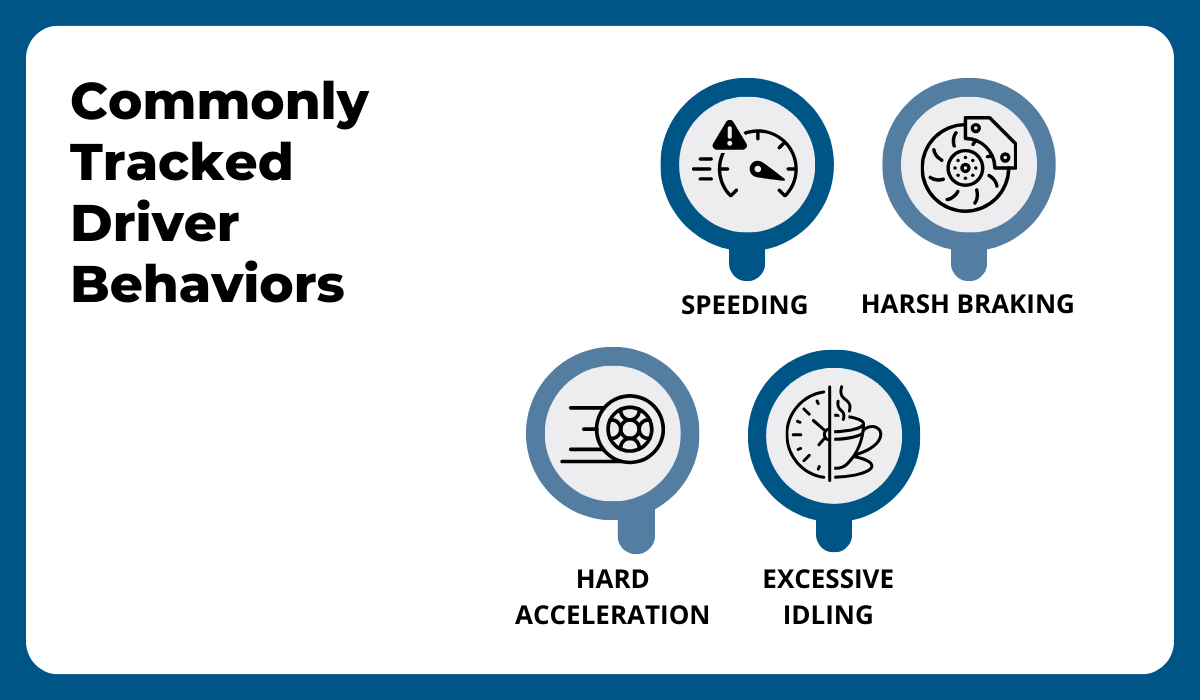
Doing so promotes safer driving practices, reducing the risks of accidents and other liabilities.
At the same time, this proactive approach enhances overall operational efficiency by minimizing fuel wastage and vehicle wear and tear.
Fleet managers who use telematics systems have the advantage of monitoring real-time data, enabling them to promptly provide either positive or negative feedback.
All in all, tracking this metric encourages efficiency and accountability, and helps build a culture of safe driving.
Accident Rate
Accident rate tracks the number of incidents relative to total miles or kilometers driven.
As such, it’s a key metric for evaluating the fleet’s safety performance.
The biggest benefit of measuring accident rates is the ability to identify patterns associated with specific routes or drivers.
By gaining more insight into these issues, businesses are more likely to opt for safety measures which are most effective for their circumstances, such as GPS tracking or video surveillance.
For instance, if the tracking showed frequent cases of speeding or cornering, installing a dashcam solution could help hold drivers accountable and encourage safer driving.
Implementing the most suitable solutions will help reduce future accidents, as shown in Verizon Connect’s research.
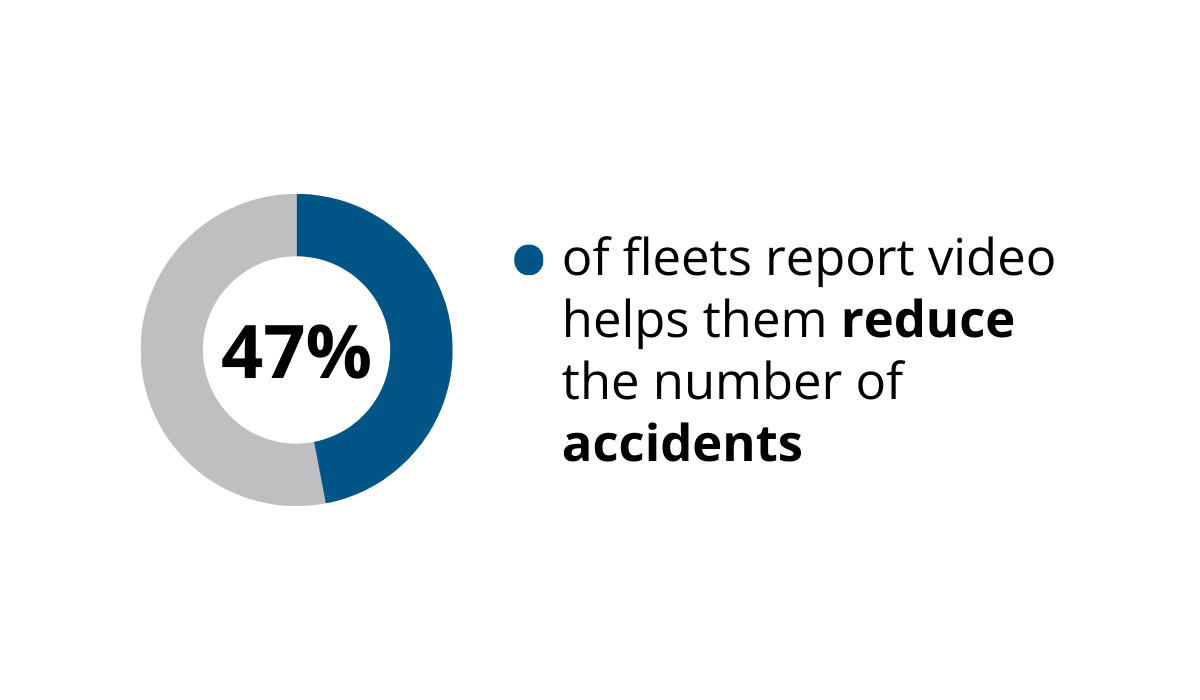
In addition to reducing accidents through targeted intervention, you can also minimize the costs of repairs and insurance claims.
That is—if you track fleet safety metrics.
Fleet Costs Metrics
These metrics shift the focus onto the financial side of fleet management.
Nevertheless, they influence both cost control and operational efficiency.
Total Cost of Ownership
Total cost of ownership or TCO refers to the overall cost of owning and operating a vehicle.
Simply put, tracking this metric ensures that you stay on top of all the expenses, from the initial purchase price to the ongoing costs of usage and depreciation.
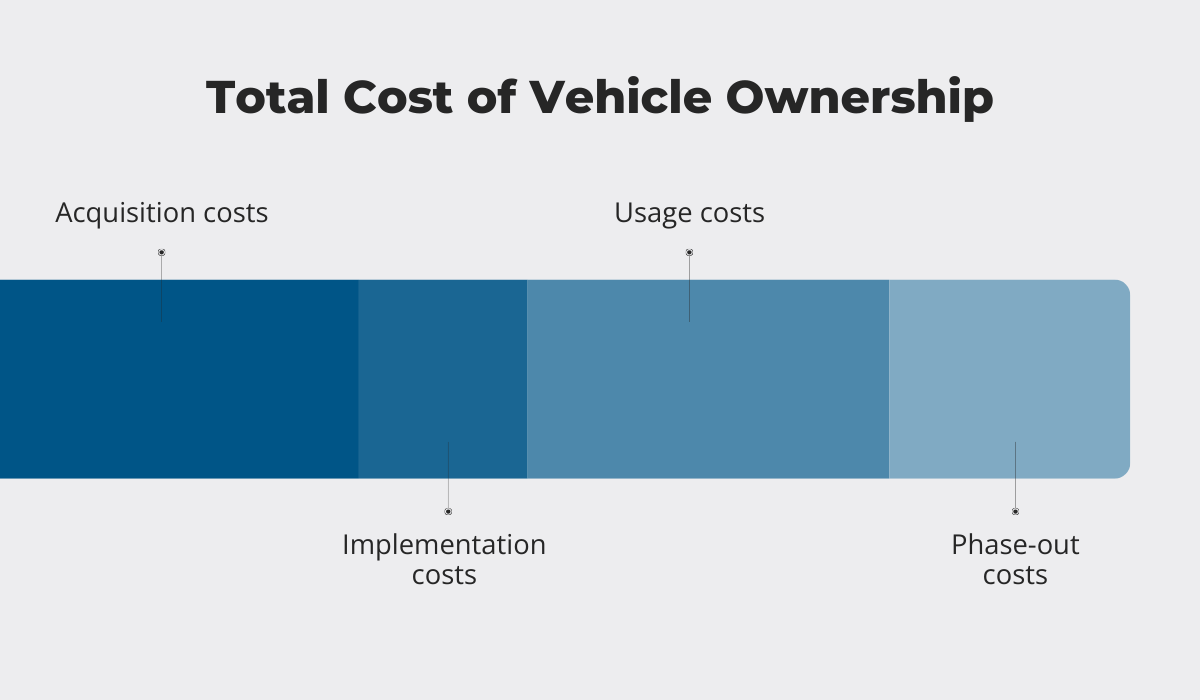
TCO is important to keep in mind because it helps fleet managers gain a comprehensive view of the vehicle’s cost efficiency.
For example, a high TCO may indicate inefficient utilization or excessive maintenance needs.
By comparing it across vehicles, you can identify key areas for cost reduction and optimize your fleet.
In short, managing TCO effectively allows companies to lower operational expenses, replace aging assets, and improve their long-term profitability.
Cost per Mile
Cost per mile (CPM) calculates the average expense incurred for each mile or kilometer driven by the fleet.
However, this doesn’t mean you’re tracking only fuel consumption.
Instead, you should track all the costs related to operating a vehicle or a fleet of vehicles over a specific distance.
This includes:
- Maintenance
- Insurance
- Depreciation costs
Monitoring this metric brings a more detailed view of operational efficiency, allowing you to flag issues such as inefficient route planning, poor vehicle health, or increasing fuel prices.
As long as you have records of total expenses and mileage, you can track CPM over the course of the year and get valuable insights for budgeting and financial forecasting.
Most importantly, it enables fleet managers to make data-driven decisions about the composition of their fleet to enhance profitability and allocate resources more effectively.
Depreciation Rate
Depreciation rate measures the pace at which a vehicle loses its value due to usage and age.
Keeping an eye on this metric helps fleet managers understand the financial impact of vehicle ownership from a different angle and implement the most efficient measures.
Calculating the depreciation rate of fixed assets can differ greatly, but in fleet management, you should consider the overall usage, e.g. total miles driven.
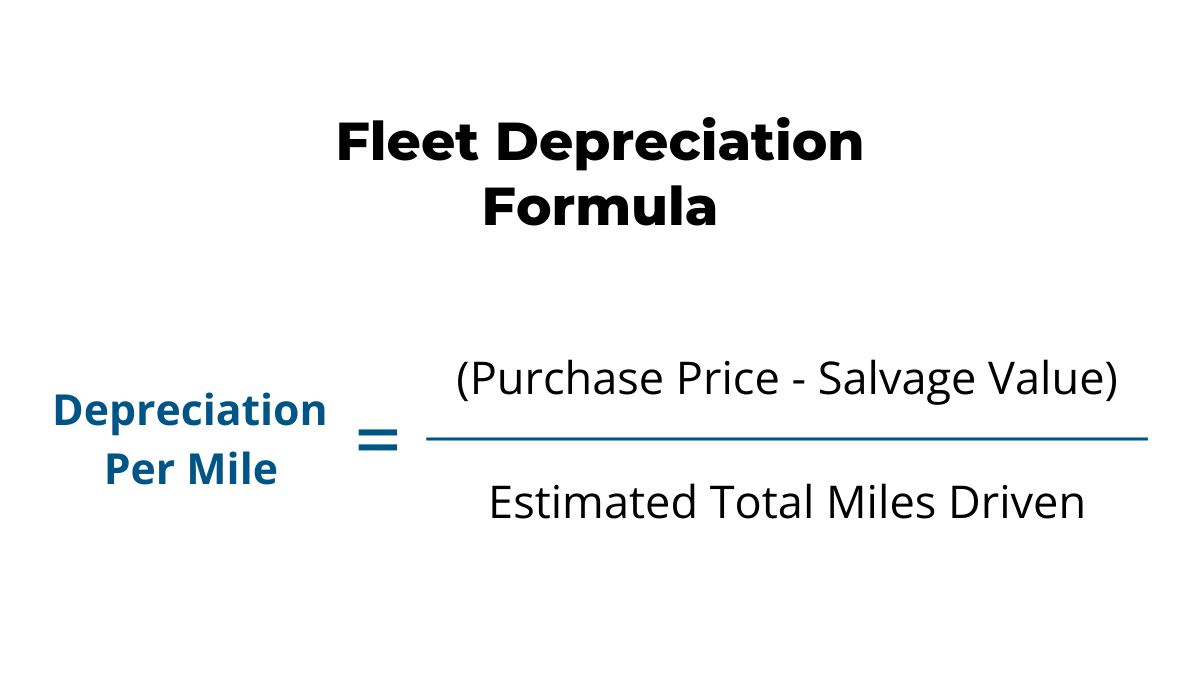
While the loss of value is inevitable, faster depreciation usually suggests vehicle overuse and lack of maintenance, but it can also point to changing market conditions.
By regularly monitoring depreciation, companies are more effective at balancing vehicle lifecycle costs, optimizing replacement schedules, and making data-driven decisions on purchases.
In conclusion, this metric helps maximize the value extracted from assets while minimizing long-term financial losses.
Conclusion
Effective fleet management goes beyond experience or intuition—it requires clear and actionable data.
By tracking these essential metrics, you’re one step closer to optimizing operations and making confident decisions that will benefit your construction business in the long run.
Thanks to modern technology and fleet management systems, monitoring fleet utilization, maintenance, safety, and costs has never been easier.
So, if you haven’t been tracking these metrics before, now is the perfect time to start!


