
Key Takeaways:
- 78% of construction professionals find digital reporting easy.
- Visual reports help stakeholders grasp complex data quickly and act faster.
- Standardized templates reduce errors and streamline communication across projects.
- Integrating data from existing software creates real-time, reliable reports.
Missed deadlines. Budget overruns. Lost tools.
Without effective construction reporting, all of these can become a reality.
From tracking material usage to forecasting equipment downtime, clear reporting keeps your timeline sharp and your bottom line protected.
But not all reporting systems are created equal.
In this article, we’ll explore the five best practices for construction reporting that will help you spot red flags early and keep your projects moving forward.
In this article...
Using Standardized Templates or Reporting Tools
Standardized reporting templates and digital tools are the backbone of consistent, clear, and efficient construction reporting across projects.
When project teams use different formats for their reports, confusion and errors are inevitable.
Whether it’s a missing field in a daily log or inconsistent spellings, reporting discrepancies can quickly erode communication and hinder smart decision-making.
As one Chief Information Officer said in a report by Autodesk:
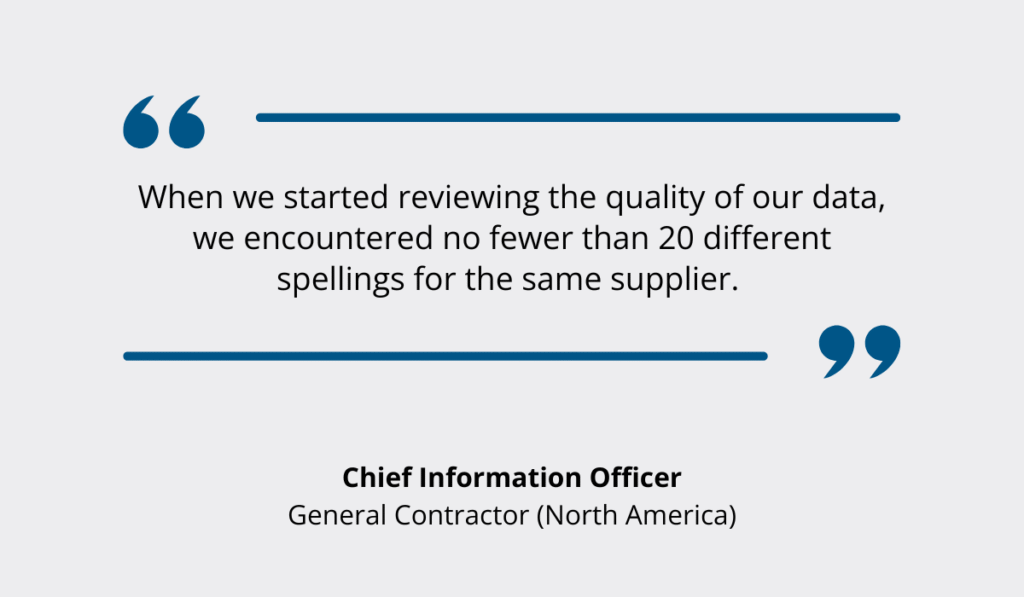
Illustration: GoCodes Asset Tracking / Quote: Autodesk
What solution would prevent such issues?
A unified reporting structure.
Standardized templates ensure that crucial information, such as safety observations, labor usage, and project progress, is consistently captured and easily compared across job sites.
When every report follows the same logic, managers can compare data with ease, spot red flags early, and avoid miscommunication.
Standardization also saves time, reduces rework, and eliminates the need to build reports from scratch for every project.
Construction companies can begin by rolling out company-wide templates for essential reports like daily logs, progress reports and cost allocation breakdown.
For instance, a standardized daily log might include fields for:
- Weather conditions
- Inspection summaries
- Time tracking
- Photo documentation
Digital reporting tools take this a step further by enabling teams to auto-generate daily reports across mobile and desktop platforms.
Here’s a great example: this construction inspection report template holds fields for % of work completed, total working days, name of the area engineer, etc.

Source: Texas Department of Transportation
Using templates like this across your reporting flow simplifies internal communication and ensures that stakeholders receive accurate, up-to-date data.
In fact, one study found that 78% of construction professionals say digital reporting is easy, while just 8% considered it difficult.

Illustration: GoCodes Asset Tracking / Data: International Journal of Construction Management
So, if you are concerned about whether your team will adapt to standardized templates and digital tools, this data should be reassuring.
All in all, standardizing your construction reports, especially with the help of digital tools, removes guesswork, strengthens decision-making, and keeps every project stakeholder aligned.

Drawing Data from Your Other Software
Construction companies can also strengthen their reporting practices by pulling data from software they already use.
Many firms rely on specialized software like GPS-based asset tracking solutions to manage and track equipment and vehicles.
While these platforms are often seen as purely operational, they hold a goldmine of reporting data, from equipment usage to location history.
By integrating this information into your reporting process, you move from manual, error-prone entries to automated, real-time insights.
Instead of logging hours and tool movement into disconnected spreadsheets, teams can streamline reporting into a single, unified flow.
This makes them more efficient, and it helps prevent the costly mistakes that come from incomplete or inconsistent data.
And the stakes are high.
A survey of 599 construction professionals revealed that 52% of all rework in the U.S. was caused by poor project data, contributing to $31.3 billion in annual losses.
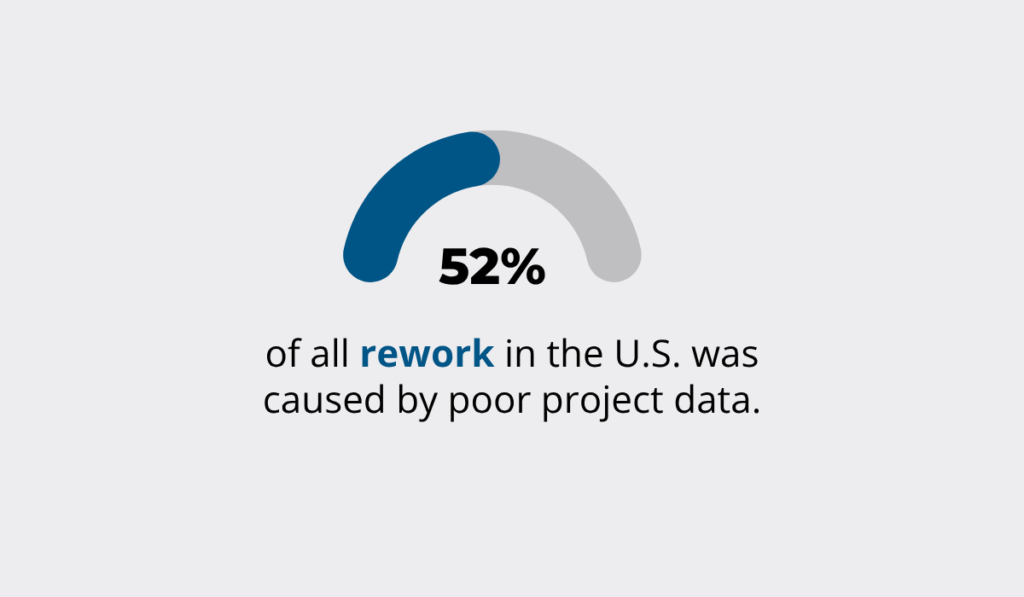
Illustration: GoCodes Asset Tracking / Data: Autodesk
That’s where platforms like GoCodes Asset Tracking come in.
Best known as an asset tracking and management solution, GoCodes Asset Tracking also offers powerful reporting capabilities.
It allows construction teams to monitor equipment usage and status across multiple sites.

Source: GoCodes Asset Tracking
You can apply filters to track tool check-ins/outs and log equipment runtime for specific assets or locations.

Source: GoCodes Asset Tracking
These data points can be automatically populated into custom dashboards, displaying real-time metrics such as location data, last check-in dates, and asset idle time.

Source: GoCodes Asset Tracking
Rather than jumping between siloed systems or spreadsheets, GoCodes Asset Tracking centralizes everything in one interface.
You can even build tailored reports for accounting, auditing, or field management.
Think about all the possibilities.
Need to know how many hours a subcontractor’s backhoe was active last week?
Or when it is due for servicing?
With a few clicks, that data is ready.
In short, pulling data from software you already use helps you stay ahead of issues and make decisions backed by real-time, accurate insights.
Ensuring Data Accuracy
Without accurate and timely data, even the most robust construction reports will fall short in driving informed decisions.
Construction reporting relies on the twin pillars of data integrity and promptness.
Whether you’re reviewing weekly cost forecasts or checking daily labor hours, one incorrect figure can lead to overbilling, compliance risks, or decisions based on false assumptions.
And let’s face it, no one wants to put out fires that accurate data could have prevented.
In the previously mentioned global contractor study by Autodesk, which spanned 18 countries, researchers found that bad data doesn’t just mean incorrect figures.
It includes missing or incomplete data as well—all of which contribute to costly project inefficiencies.

Illustration: GoCodes Asset Tracking / Data: Autodesk
That’s why a core best practice for successful construction reporting is building a system that prioritizes data accuracy from the ground up.
In other words, data that goes into reports has to be reliable in the first place.
Even the best platform can’t correct human habits.
If your crew logs hours days later from memory or skips inputting subcontractor usage entirely, you’re inviting errors.
So, how do you get it right?
Start by introducing clear validation checks. This could be as simple as double-checking daily entries for labor and equipment usage and reviewing material costs before the report is submitted.
Set firm but realistic deadlines, such as daily logs by end of day or weekly reports by Friday.
When the entire team understands the reporting rhythm, errors naturally shrink.
A strong example of data accuracy in action comes from Tankersley Construction Inc., a U.S.-based contractor.
The company leveraged Buildertrend’s digital time clock to enforce on-site supervisor verification of labor hours.

Source: Buildertrend
Instead of relying on crew self-reporting or end-of-week estimation, supervisors approved entries daily via the software.
This reduced inflated hours and allowed them to keep up with tighter margins, explains the president, Steven Tankersley:

Illustration: GoCodes Asset Tracking / Quote: Buildertrend
Accurate data is the difference between steering your project forward and chasing your tail.
By focusing on accuracy and timing (two things completely within your control), you’ll build stronger reports, spot issues sooner, and avoid the mess that bad data leaves behind.
Focusing on Actionable Metrics
Not all data is created equal. When it comes to daily construction reporting, the most valuable metrics are those you can act on immediately.
Too often, teams get bogged down by an excess of numbers.
In the previously mentioned Autodesk report, a study involving 3,916 contractors found that 80% of respondents reported an increase in project data due to digital tools.
Yet 83% admitted that at least 25% of this data was unusable.

Illustration: GoCodes Asset Tracking / Data: Autodesk
That means more data isn’t better.
Better data is better.
Instead of flooding reports with vanity metrics or irrelevant figures, focus on a concise set of actionable KPIs that reflect true project health and support real-time decision-making.
Here are four KPIs you should track consistently:
| Schedule performance | Tracks whether project activities are being completed on time compared to the original plan. | It helps identify delays and assess overall timeline performance. |
| Budgets vs. actual costs | Measures the difference between planned costs and actual spending. | It helps teams control cost overruns, manage cash flow, and improve future cost forecasting. |
| Safety indication rates | Calculates the number of reportable safety incidents per 1,000 man-hours worked. | It reflects job site safety performance and compliance with safety standards. |
| Resource utilization | Indicates how efficiently labor and equipment are deployed. | High utilization means resources are productive, while low rates reveal idle time or scheduling gaps. |
Focusing on these KPIs in reporting gives your team a clear, consistent view of current performance and helps in identifying issues before they escalate.
Nathan Rosenker, a risk engineer at Liberty Mutual Insurance, stresses that technology can turn metrics into action:

Illustration: GoCodes Asset Tracking / Quote: FMI
In other words, actionable KPIs tell you what needs attention.
Technology ensures you know how and by whom it will be resolved.
By zeroing in on a handful of relevant KPIs and acting on them promptly, you cut through the noise and focus on what truly drives performance.
When reports highlight schedule slippage, cost drift, safety concerns, or under-utilized equipment, your team can respond faster and with greater precision.

Presenting Data in a Digestible Format
Reports should present data clearly, transforming raw data into visual formats that make trends, patterns, and comparisons easy to grasp.
Busy stakeholders do not have time to read dense text or sift through massive spreadsheets.
Clear, well-chosen visuals, such as bar charts for budget variance, line graphs for schedule trends, and heatmaps for resource allocation, make complex updates quick to interpret.
Sarah Keyte, technical director at HKA, notes the advantage such models carry:

Illustration: GoCodes Asset Tracking / Quote: Autodesk Construction Cloud
A great example of the implementation of visual data comes from DIALOG, a collaborative team of urban planners, architects, and engineers.
Their team used Tableau’s dashboard to visualize construction data.
Instead of scanning rows or submittal logs, their weekly reports displayed visual indicators that instantly show what’s on time, overdue, or awaiting response.

Source: Onware
Another example is WSP, a global services firm.
They faced challenges managing a project due to their reliance on spreadsheets for risk registers and status reports.
After getting a real-time project control and reporting solution from Mastt, they gained faster access to project status and stronger visibility across risks and timelines.
When visuals are used well, reports stop being long lists of numbers and become interactive reference points that guide decision-making, especially for executives who need to scan, assess, and act quickly.
So, rather than drowning stakeholders in unstructured data, use visuals to show the big picture at a glance.
Conclusion
By now, it’s clear that great construction reporting isn’t about the volume of information but its value.
When reports are standardized, accurate, and built around actionable insights, they stop being static documents and become tools for timely, informed decision-making.
Tracking the right metrics, ensuring accuracy, and visualizing progress all work together to eliminate guesswork and drive smarter execution.
So, start small, build consistency, and you will see how quickly effective reporting strengthens site coordination and stakeholder confidence.

