Asset management is a vital part of any business that relies on equipment or assets to complete its operations every day.
If your team is to make data-backed decisions that benefit your business, they must track key metrics and identify the major issues in your operations.
In this post, we’ll be talking about 10 asset management metrics you need to keep an eye on to improve the maintenance of your assets.
In this article...
Asset Availability
Asset availability is the calculated time during which the gear is performing work.
It is one of the key metrics you should track because it reveals how much operational time is available from an asset.
If a piece of machinery can operate for the entire day without interruptions, it’s considered to be in performing condition.
Determining the availability of your assets helps you make productivity projections and time-related goals for future operations.
You should track asset availability because it shows how much downtime is contributing to the overall performance of your equipment.
When unplanned downtime occurs, it means that your gear is not performing in top order.
Having a lot of downtime means that a smaller amount of work can be completed with an asset, which affects your overall performance. Let’s look at an example of how you can calculate the availability of your asset.
The asset ran for 100 hours and had 2 hours of downtime because of an unplanned breakdown.
Availability = 100 / (100 + 2)
Availability = 100 / 102
Availability = 0.98
Availability = 98%
In his example, the observed asset was available 98% of the time.
You should track the availability of your assets so you can get a clear picture of how much time they are actually available for operations.
Schedule Compliance
Schedule compliance is a vital metric to track if you want to improve the reliability and performance of assets. It determines whether the asset is delivering its planned output on a weekly basis.
When you track schedule compliance, you get a clear idea of how much work gets done every week.
However, when calculated poorly, this metric can give decision makers a false sense of high productivity.
A misleading calculation typically shows high schedule compliance because of the expectation of unexpected setbacks or downtime will occur. This leads managers to schedule less labor than is actually available.
When a smaller target is reached, it is mistaken for high schedule compliance, when in reality, the asset is not being used to its full potential.
Let’s say you scheduled your workers with 100 orders, and you expect 20% of maintenance time or unexpected setbacks. This means you could be satisfied with an 80% compliance rate.
However, if you load your crew with next week’s work after the target has been reached, another 20% of maintenance time won’t occur.
This way, your crew could complete more orders and boost productivity.
Schedule compliance rates are great metrics for tracking productivity, but always be skeptical of very high compliance rates.
Mean Time to Failure
Mean Time to Failure is a metric you should track because it determines the time it takes before a critical failure occurs, after which the asset can’t be repaired anymore.
Understanding MTTF metrics is important because it tells you how long you can rely on the asset before having to buy a new one to replace it.
This way, you have a calculated lifespan of an asset, which will determine your future asset investments and costs.
Not tracking MTTF can lead to unplanned purchases and stress your budget.
If some assets, such as heavy gear, last shorter than expected, with proper tracking techniques you can identify the reasons why they break down.
This enables maintenance improvements and better spending calculations.
Let’s imagine you’re trying to calculate the MTTF of 3 identical assets in your office—it can be anything from lightbulbs to machinery.
Say System A lasts 18 hours, System B lasts 17 hours, and System C 20 hours.
When you divide 55 hours with 3, you get an average of 18.3 hours, which means that every 18.3 hours you should expect to buy a new identical system.
MTTF is a vital metric for understanding how long assets are expected to last before they have to be completely replaced.
Mean Time Between Failures
Mean Time Between Failures (MTBF) is a vitally important metric for asset management because it measures the performance and safety of the equipment.
MTBF refers to the time that is expected to elapse between inherent failures of a system in operation.
It does not include scheduled maintenance downtime and focuses solely on unplanned breakdowns.
MTBF is represented in hours and shows how long a system will operate without interruptions caused by failure.
Without MTBF calculations, you can’t determine how reliable your system or asset is.
The higher the MTBF is, the more reliable your system is. In other words, you should look at MTBF as the likelihood that your system will operate without breakdowns.
For example, if you have an asset like a company laptop that’s been used for 100 days, 10 hours per day, and has had 3 failures, its MTBF is 333.3 hours.
This means that the laptop has an average of 333 hours between failures.
Thanks to MTBF, you can predict the likelihood of your asset’s next malfunction.
To get ahead of system breakdowns, you need to track MTBF and react in a timely manner, so your systems are safe and high-performing.
Mean Time to Repair
Mean Time to Repair (MTTR) is a metric that reveals the time it takes to repair a system after it has broken down or stopped working.
MTTR is used to calculate benchmarks so that maintenance teams can improve efficiency, boost productivity and minimize downtime and repair time.
It includes every maintenance step, from diagnosing a problem to fixing it completely.
Being thoroughly familiar with your MTTR allows you to own every second of maintenance time.
After an MTTR analysis, your team should be able to evaluate the effectiveness of the maintenance process and make sure to implement the best maintenance practices.
This will help them drastically reduce the time it takes to repair assets, resulting in less downtime.
You should perform MTTR analyses after every asset failure and compare them to spot patterns.
For instance, if in the past 3 months your asset has 40 hours’ downtime and broke down 6 times, your MTTR is 6.6 hours per 3 months.
You can calculate MTTR by dividing total asset downtime by the number of breakdowns or failures.
This way, you can get a clear picture of how much time you’re spending on asset repairs.
Tracking MTTR is vitally important for quality asset management and understanding your repair process.
Overall Equipment Effectiveness
Overall Equipment Effectiveness (OEE) is a metric used to measure the overall performance of your equipment in a set period.
You need to track OEE so you can determine how efficient a piece of equipment is during operations.
Calculate the OEE by multiplying the ideal time to produce a unit with the number of units produced and divide the sum with planned production time.
OEE scores are represented in percentages, and the higher they are, the more productive your production is.
With this metric, you can identify what affects your production process negatively.
OEE is vital for pinpointing if production hauls are in asset availability, performance, or low quality of produced units.
This way, you know exactly which part of production must be improved to boost effectiveness.
Let’s imagine that during a 6-hour shift, a factory will produce 6000 nails, with 2 seconds to produce each one. Out of produced nails, 200 will be defects.
OEE = (ideal cycle time x produced goods) / planned production time
OEE = (2 seconds x 5800 nails) / 6 hours (or 21600 seconds)
OEE = 11600 / 21600 = 0.537
OEE = 53.7%
In this case, our fictional factory’s OEE is 55.5%.
Generally, you should track OEE because, without it, you can’t tell how effective your production really is.
Planned vs. Unplanned Work Ratio
Planned vs. Unplanned Work Ratio (PUWR) is a key metric because it reveals whether planned or unplanned maintenance work predominates and in what percentage. This ratio comprises two complementary metrics, Percent of Emergency Work and Percent of Planned Work:
- Percent of Emergency Work are unplanned reactive tasks that happen when something goes wrong and needs immediate attention.
- Percent of Planned Work represents planned maintenance tasks that are preventive in nature.
If a company’s Work Ratio is dominated by planned work, it means most of their maintenance work is preventive.
Before calculating your Planned vs. Unplanned Work Ratio, track all types of maintenance work in your business.
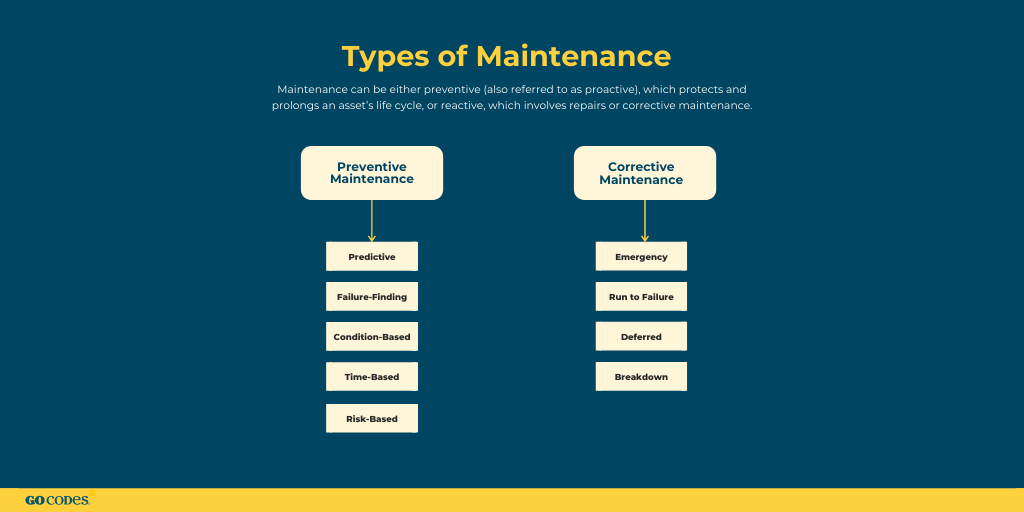
You can calculate your business’ Planned vs. Unplanned Work Ratio if you divide your planned maintenance hours by total maintenance hours and multiply the result by 100.
This will give you a clear picture of what percentage of your maintenance is planned.
Say you’re running a factory that has 300 maintenance hours per month, 250 of which are planned. Then you use the following formula:
PUWR = (250 / 300) * 100
PUWR = 0.833 * 100 = 83.3%
The Planned vs. Unplanned Work Ratio of our imaginary factory is 83.3% which means planned maintenance predominates.
Organizations should actively track their PUWR and strive to maximize their planned work ratio.
Incident Resolution and Response Time (TRSL vs. TRSP)
Incident Resolution and Response Time is an important asset management metric because it reveals the average elapsed time from when an incident was reported to when it’s solved.
Incident Resolution and Response Time comprises two related metrics:
- TRSP is the response time, i.e., the average time that elapses from when a problem is reported to when a professional in charge of maintenance has responded.
- TRSL is the resolution time, i.e., the time it takes to resolve breakdowns or incidents.
Both TRSL and TRSP are important metrics for tracking the effectiveness of support for fixing issues.
While TRSL shows how long it takes to solve a problem, TRSP reveals how much of that time can be reduced with an incident-reporting solution.
If you want to improve the time it takes to resolve incidents and decrease downtime, you have to track both of these metrics.
According to a study by SuperOffice, 62% of companies fail to reply to customer service emails on time, and take on average 12 business hours and 10 minutes to respond.
Understanding the average response time is needed for implementing the right solutions to make problem reporting faster.
That way, resolution time can be reduced, improving the productivity of your company.
Work Order Closure Rate
Every asset management strategy should track Work Order Closure Rate (WOCR) as a key metric.
Tracking Work Order Closure Rate allows you to see how many maintenance work orders have been successfully closed out of all the commissioned orders.
Knowing this metric, you can understand the planning and labor efficiency of your maintenance work orders.
To be successful at tracking and improving your WOCR, collect all your maintenance work order reports.
When you have all your maintenance work orders collected, you divide the number of closed orders by the total number of orders and multiply it by 100.
This gives you a percentage of closed work orders that you can use to improve your maintenance.
For example, if you run a plant with 600 commissioned maintenance work orders and 512 closed orders in the last 12 months, you will use the following formula to calculate WOCR:
WOCR = (512 / 600) * 100
WOCR = 0.852 * 100 = 85.3%
In this example, we can see that your plant closes 85.3% of its 600 work orders.
To get a grip on how many maintenance work orders get completed in your business, track this metric often.
Labor Cost per Project
Labor costs are one of the most difficult costs to calculate, but you need to track them if you want to make accurate estimates of overall project costs.
You should calculate labor costs per project in a cohesive way to reduce guesswork and improve accuracy.
When making labor cost calculations, use labor units as measurements of time. Labor units represent the time it takes to complete a single project-related task.
To calculate the labor cost per project, multiply the direct labor hourly rate by the number of direct labor hours that are needed to complete one labor unit.
This way, you have a clear calculation of labor costs per project, in terms of work hours.
Labor cost calculations are a must for planning and managing projects effectively.
For example, if you’re calculating the labor costs of a project and the hourly rate of your worker is $15, and it takes 4 hours to complete one unit, the direct labor cost is $60 per unit.
After calculating direct labor costs of all units, add them together, and you’ll have an estimate of labor costs per project.
This way, you can tell how much direct labor will add to the project cost.
Labor cost per project is a vitally important metric for overall project cost estimations.
Conclusion
Creating a successful asset tracking and management system can be a challenge for many companies struggling to manage their many assets.
Thankfully, knowing which metrics to track will help your team use data to understand how to improve.
Keep your eye on these metrics, and use their insights to boost your asset management and maintenance.
GoCodes Asset Tracking Can Help
We use QR code tags with a unique visual code that you can scan with your smartphone. When scanned, GoCodes Asset Tracking tags provide GPS information about equipment location, making asset management easy.
Sign up for a free trial here.


