
Key Takeaways:
- 91% of construction teams still use paper in their processes, increasing errors and slowing decisions.
- Project teams spend 13 hours weekly searching for fragmented data across systems.
- Inconsistent standards and naming conventions make construction reporting difficult.
- Only 29% of firms connect analytics to action.
At first glance, construction reporting may seem like a boring, administrative task, but it’s actually a crucial element of a successful project.
If reporting is not accurate and consistent, projects stall, miscommunication spreads, and costly mistakes go unnoticed.
And that’s just the tip of the iceberg.
The challenge is that reporting itself is not easy.
Teams often face obstacles such as heavy reliance on manual processes, fragmented data, and missing insights that make informed decision-making difficult.
If left unresolved, these issues can quickly escalate into project delays, cost overruns, and dissatisfied clients.
That’s why today we’ll look at the most common challenges of construction reporting and share tips on how to solve them.
In this article...
Overdependence on Manual Processes
We may live in the peak of the digital and automation age, but we still do some things manually.
And the construction industry is no different.
According to the latest report by Quickbase, 91% of teams still use paper in their processes, while only 12% have adopted fully automated systems such as ERP software.
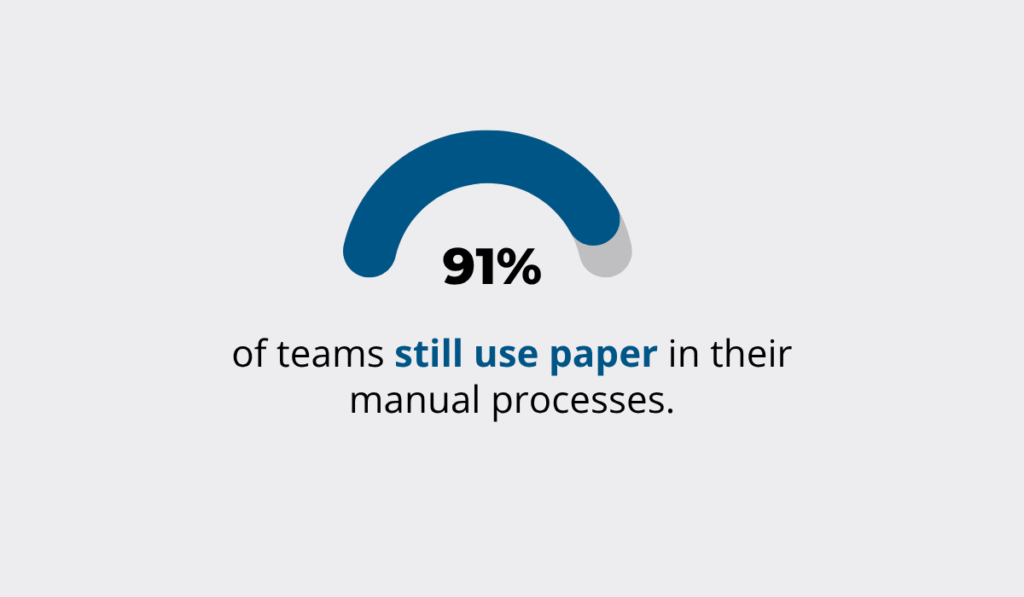
Illustration: GoCodes Asset Tracking / Data: Quickbase
Unfortunately, overrelying on manual processes can backfire in lots of ways.
First, errors are far more common when data is entered by hand.
A mistyped number in a spreadsheet or a misplaced decimal point can go unnoticed, yet have serious consequences, such as ordering the wrong amount of concrete or underestimating labor hours.
Second, these errors are harder to catch and correct.
Reports need to be checked line by line, which lengthens review time. And every hour spent fixing mistakes is an hour lost from actual site management.
Third, manual reporting does not scale.
While spreadsheets and paper logs may be manageable on a small project, they quickly collapse under the weight of multiple sites, dozens of subcontractors, and hundreds of daily entries.
Managers often find themselves buried in documents instead of focusing on project delivery.
Finally, this lack of efficiency creates bigger financial risks.
With incomplete or outdated data, project managers lose visibility into costs and progress.
When decisions are based on unreliable reports, overruns in time and budget become much more likely.

Illustration: GoCodes Asset Tracking
So, manual reporting may seem cost-effective at first, but it’s a massive time and resource drain.
And worst of all, it produces unreliable data, which is, according to a report by Autodesk, the greatest risk to project decision-making for 36% of industry leaders.

Illustration: GoCodes Asset Tracking / Data: Autodesk
That risk becomes critical in construction, where decisions often need to be made on the spot, whether to accelerate a schedule, respond to an emergency, or address an urgent stakeholder request.
Digital tools such as ERP systems or timekeeping software solve this problem by automating repetitive reporting tasks and providing real-time, accurate data.
Instead of waiting for a weekly report, managers can instantly see labor hours logged, materials used, or equipment downtime.
Also, ERP software stores all reporting data in one platform, eliminating the inefficiency of searching across multiple spreadsheets, emails, or paper files.

Source: NetSuite
When everyone works from the same source of truth, reporting becomes faster, decisions more reliable, and collaboration much smoother.
The benefits extend beyond efficiency.
By reducing manual errors and streamlining communication, digital systems also improve team satisfaction, strengthen compliance with regulations, and create a more transparent project environment.

Fragmented Data Across Systems
One of the biggest obstacles in construction reporting is fragmented data across multiple systems, which makes it difficult to get a complete and accurate picture of a project.
According to Autodesk research from 2025, project teams spend an average of 13 hours each week just searching for the right data.

Illustration: GoCodes Asset Tracking / Data: Autodesk
This usually happens because different teams are using different systems that don’t sync.
Timekeeping might be handled in one app, material deliveries in another, while progress updates are stored in an Excel sheet.
This may result in double entries, missing details, conflicting numbers, and various other issues.
This fragmentation is especially painful for managers and executives.
They need reliable, real-time data to make better decisions and adjust their plans.
In fact, 43% of them say that time constraints and the urgency of decisions represent the biggest risk to efficient decision-making.

Illustration: GoCodes Asset Tracking / Data: Autodesk
So, if crucial data is spread across five different places, it’s almost impossible to react quickly.
Consider a project manager overseeing two job sites.
On one, the crew uses a mobile app to log hours and deliveries. On the other, the team submits updates via weekly emails and hand-filled forms.
When it’s time to prepare a mid-month progress report, the manager has to dig through inboxes, copy data from spreadsheets, and call on-site leads to verify numbers.
By the time the report is ready, half the data is already outdated, making it nearly useless for decision-making.
Industry leaders warn that the costs of unstructured or fragmented data extend beyond wasted time.
As Brad Buckles, VP of Technology and Innovation at Charles Perry Partners, explains:
“It can cost you bids, it can cost you opportunities, and it can create rework challenges. But it goes further than that. We could look at safety, we could look at project costs and controls, or pre-construction. Even marketing and accounting—each one of those presents its own challenges in data alignment.”
In other words, poor data alignment weakens performance across the entire business.
This is why it’s important to integrate reporting into a centralized system.
Construction management platforms such as Procore or Autodesk Construction Cloud allow crews to log hours, deliveries, and progress updates directly in the field, with all data synced in real time.
This provides one source of truth that reduces errors, saves time, and gives managers instant visibility into what is happening on site.
Getting all data in one, centralized place is a good start—but it doesn’t solve everything.
Inconsistent Reporting Standards
Another challenge, especially visible in large construction companies or companies managing multiple projects, is the lack of consistency in reporting standards.
When each team defines metrics differently, uses its own templates, or reports on separate timelines, comparing performance across job sites becomes incredibly difficult.
Let’s say one team reports percent completion based on schedule milestones, while another uses labor hours.
So, when leadership has to assess the team’s performance, they may have no choice but to waste valuable time on manual comparison and interpretation of data.
And even when teams submit data, a lack of standardized naming, formats, or conventions can create errors and confusion.
One Chief Information Officer at a General Contractor (North America) deals with this challenge constantly:
“When we started to review the quality of our data, we encountered no fewer than 20 different spellings for the same supplier. Sometimes the first letter was capitalized, and sometimes it wasn’t. Time and time again, we’d find instances of corporation vs. corp., company vs. co., and so on.”
On the other side, standardized construction reporting through shared templates, aligned KPIs, and synchronized update cycles allows teams to compare performance across sites quickly and accurately.
Standardization ensures that everyone is “speaking the same language,” reducing errors, improving visibility, and enabling faster, more confident decisions.
But standardizing reporting isn’t just about creating templates and naming conventions, or aligning KPIs.
It also requires standardizing the technology stack, as Paul Brennan of BAM Constructions rightly points out:

Illustration: GoCodes Asset Tracking / Quote: Autodesk
However, he further adds that there is too much technology available, and teams often try to adopt multiple overlapping tools at once.
This can create confusion rather than solve problems.
The full benefits of digital reporting—real-time, centralized, and accurate data—only materialize when both the processes and the technology stack are aligned.
Delayed Data Collection
A frequent challenge in construction reporting is delays in data collection from the field.
When daily construction reports, labor records, or equipment usage reports arrive late, or are incomplete, project managers lose visibility into site activity.
These delays can prevent timely corrective actions, allowing small discrepancies to compound into schedule slippage, budget overruns, or even contractual penalties.
For example, if a site supervisor waits until the end of the week to submit labor and material logs, discrepancies between planned and actual resource usage may go unnoticed.
By the time the issue is flagged, the project could already be two days behind, making adjustments harder to implement on time.
To address this issue, construction teams are increasingly turning to digital tools that support real-time data collection and communication.
GoCodes Asset Tracking is one of them.
Originally designed for asset management, it combines a mobile app, QR codes, GPS trackers, and a centralized platform to capture and consolidate data automatically.
For example, when employees check out a tool or piece of equipment by scanning a QR code with their phones or tablets, GoCodes Asset Tracking records who is using it, where it is, and when it is or will be returned.

Source: GoCodes Asset Tracking
This ensures managers always have accurate, up-to-date information on tool usage and availability.
Moreover, because GoCodes Asset Tracking also provides GPS trackers, it can integrate telematics data, such as fuel consumption, operating hours, or engine performance, which feeds directly into reports.

Source: GoCodes Asset Tracking
This lets managers track equipment efficiency, spot anomalies early, and make data-driven decisions about maintenance or resource allocation.
Combined with custom report-building, live dashboards, filtering, and Excel imports, these features give managers immediate access to accurate, actionable insights.

Source: GoCodes Asset Tracking
They can filter data, import Excel spreadsheets, and schedule reports that update automatically.
Delays caused by manual submissions are eliminated, managers can respond immediately when issues arise, and teams gain improved oversight to maintain schedules, budgets, and overall project visibility.

Lack of Actionable Insights
Collecting data on time is only part of the challenge.
Many construction reports still fail to provide actionable insights because raw numbers alone lack context.
And when there’s no clear context, it’s hard to make the right decisions.
The stats reflect this gap.
One third of respondents in an Autodesk and FMI survey report that inaccurate, incomplete, inconsistent, or untimely project data led to poor decisions more than half the time.
Similarly, Forrester found that while 74% of firms claim they want to be “data-driven,” only 29% are effective at connecting analytics to action.

Illustration: GoCodes Asset Tracking / Data: Forrester
This disconnect often results from outdated methods, like spreadsheets, or overly complex software that slows down reporting and makes insights hard to extract.
Even when data is accurate, teams may miss trends, correlations, or anomalies simply because it isn’t presented in a clear, interpretable way.
The solution lies in automated reporting and visualization tools.
Automated reporting ensures that key metrics are updated in real time, with predefined thresholds and alerts that flag issues before they escalate.
Visualization tools, on the other hand, transform raw data into easily digestible formats like charts, heat maps, timelines, and dashboards that reveal trends and possible red flags at a glance.
They make it easier to identify correlations, track performance indicators, and support faster, more confident decision-making at both site and executive levels.
Also, these tools smooth out communication between different stakeholders, because they present data in a way that’s universally understandable.
Take a look at GoCode’s Depreciation Dashboard in the GoCodes Asset Tracking Asset Tracking module.

Source: GoCodes Asset Tracking
The dashboard combines visual charts and pre-built reports to automatically calculate and track asset depreciation.
With visual dashboards, filtering, and automated insights, construction teams gain a much clearer view into their data.
So, it’s safe to say these reports aren’t just stacks of logs and numbers.
They can be a powerful source of insights and more strategic decision-making.
Ultimately, when construction firms turn raw data into actionable insight, they gain a competitive advantage—one that supports smarter planning, tighter coordination, and more successful project delivery.
Conclusion
Construction reporting can either be a bottleneck or a crucial element of a construction project’s success.
When a team incorporates automation into their workflow, establishes clear reporting standards, streamlines fragmented data, and turns all that into actionable insights, great things can happen.
Construction companies can make faster decisions, avoid costly mistakes, and keep projects moving on time and on budget.
That’s why making the mindset switch from “reporting is a necessary evil” to “reporting is key for business success” is more important than ever.

