Create Custom Reports, Charts & Dashboards
Introduction
To run a successful business, leaders require easy access to accurate, timely and up-to-date information about every aspect of the operation. The longer a problem persists, unnoticed, the larger the negative impact on costs and quality. It’s reporting that provides the lens that allows leaders to keep their eyes open to emerging issues.
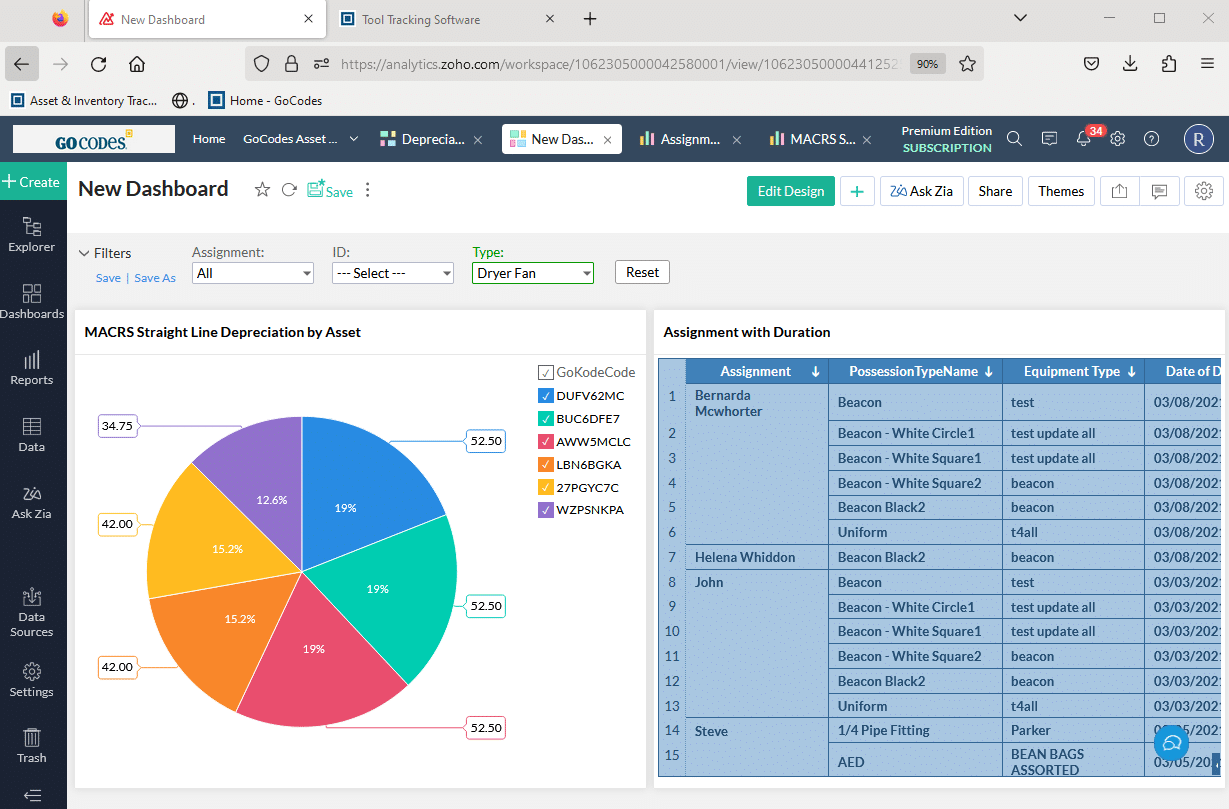
GoCodes’ Enterprise accounts include our powerful and easy-to-use reporting and analytics module. With GoCodes’ Enterprise Reporting, you can quickly design your own custom reports, include them in dashboards, schedule them to be created automatically and share them with your team via an email or URL link.
The GoCodes Enterprise Reporting module includes an easy-to-use ‘drag and drop’ report designer that provides you with complete access to your asset data. You can sort, filter, combine and present information, in the way that best meets your organization’s needs. You can, for example, use simple tabular reports that show only the data that is needed. Or you can utilize more sophisticated reporting that allows you to provide a more powerful summary with pivot table reports that include automatic total calculations and more.
If you prefer to create visual representations, you can build a variety of common charts such as line graphs, pie charts, bar charts as well as more sophisticated bubble charts. Potently, every type of graph can be created in seconds.
If your organization’s focus is on flexibility and control, you can utilize SQL commands to create your own custom data tables for use in your reports. Using this feature, your new custom tables can include embedded calculations, too.
Data can also be imported from multiple external sources such as Excel spreadsheets, for example. You can link this information to your GoCodes data to enhance, collate and create sophisticated reporting that works for you.
Just as importantly, our professional services team looks forward to providing you with any training you need, so that you can make the most of the powerful reporting features that GoCodes includes.
Users can:

- Create and save custom reports in seconds using our ‘drag and drop’ designer.
- Build charts & dashboards to share with your team.
- Share reports, charts and dashboards in multiple formats like Excel, PDF, HTML & CSV.
- Share dynamic reports with your team as a web URL where the data updates automatically.
- Schedule reports to be automatically created and emailed to your team each week.
- Enrich your reports with additional data sources like Excel and common databases.
- Develop powerful custom data tables, using SQL and embedded calculations.
Roles & Access
- Reporting feature is included with most Enterprise accounts.
- Professional accounts may add the reporting module for an additional charge.
Watch this Feature in Action
Learn more here.
